

A layer of smoke has disrupted air quality throughout Canada’s and the United States’ eastern coasts, causing the region to have the worst air pollution in North America as of Tuesday, June 6, according to the World Air Quality Index. Officials in Ontario and Quebec have issued warnings about the hazards of wildfire smoke on human health as forest fires continue to burn.
To safeguard pupils, schools on the East Coast of the United States canceled outdoor activities such as sports practices, field trips, and breaks. On Wednesday, flights were canceled, and millions of Americans were advised to remain indoors as smoke from Canadian wildfires moved south, blanketing cities in a thick yellowish haze.
The National Weather Service of the United States issued air quality warnings for almost the entire Atlantic coast. Health experts in states ranging from Vermont to South Carolina, and as far west as Ohio and Kansas, advised citizens that spending time outside might create health concerns owing to the number of small particles in the air. The world-famous skyline of New York, which is typically visible for miles, appeared to vanish under the strange cloud of smoke, which several locals claimed made them feel ill.
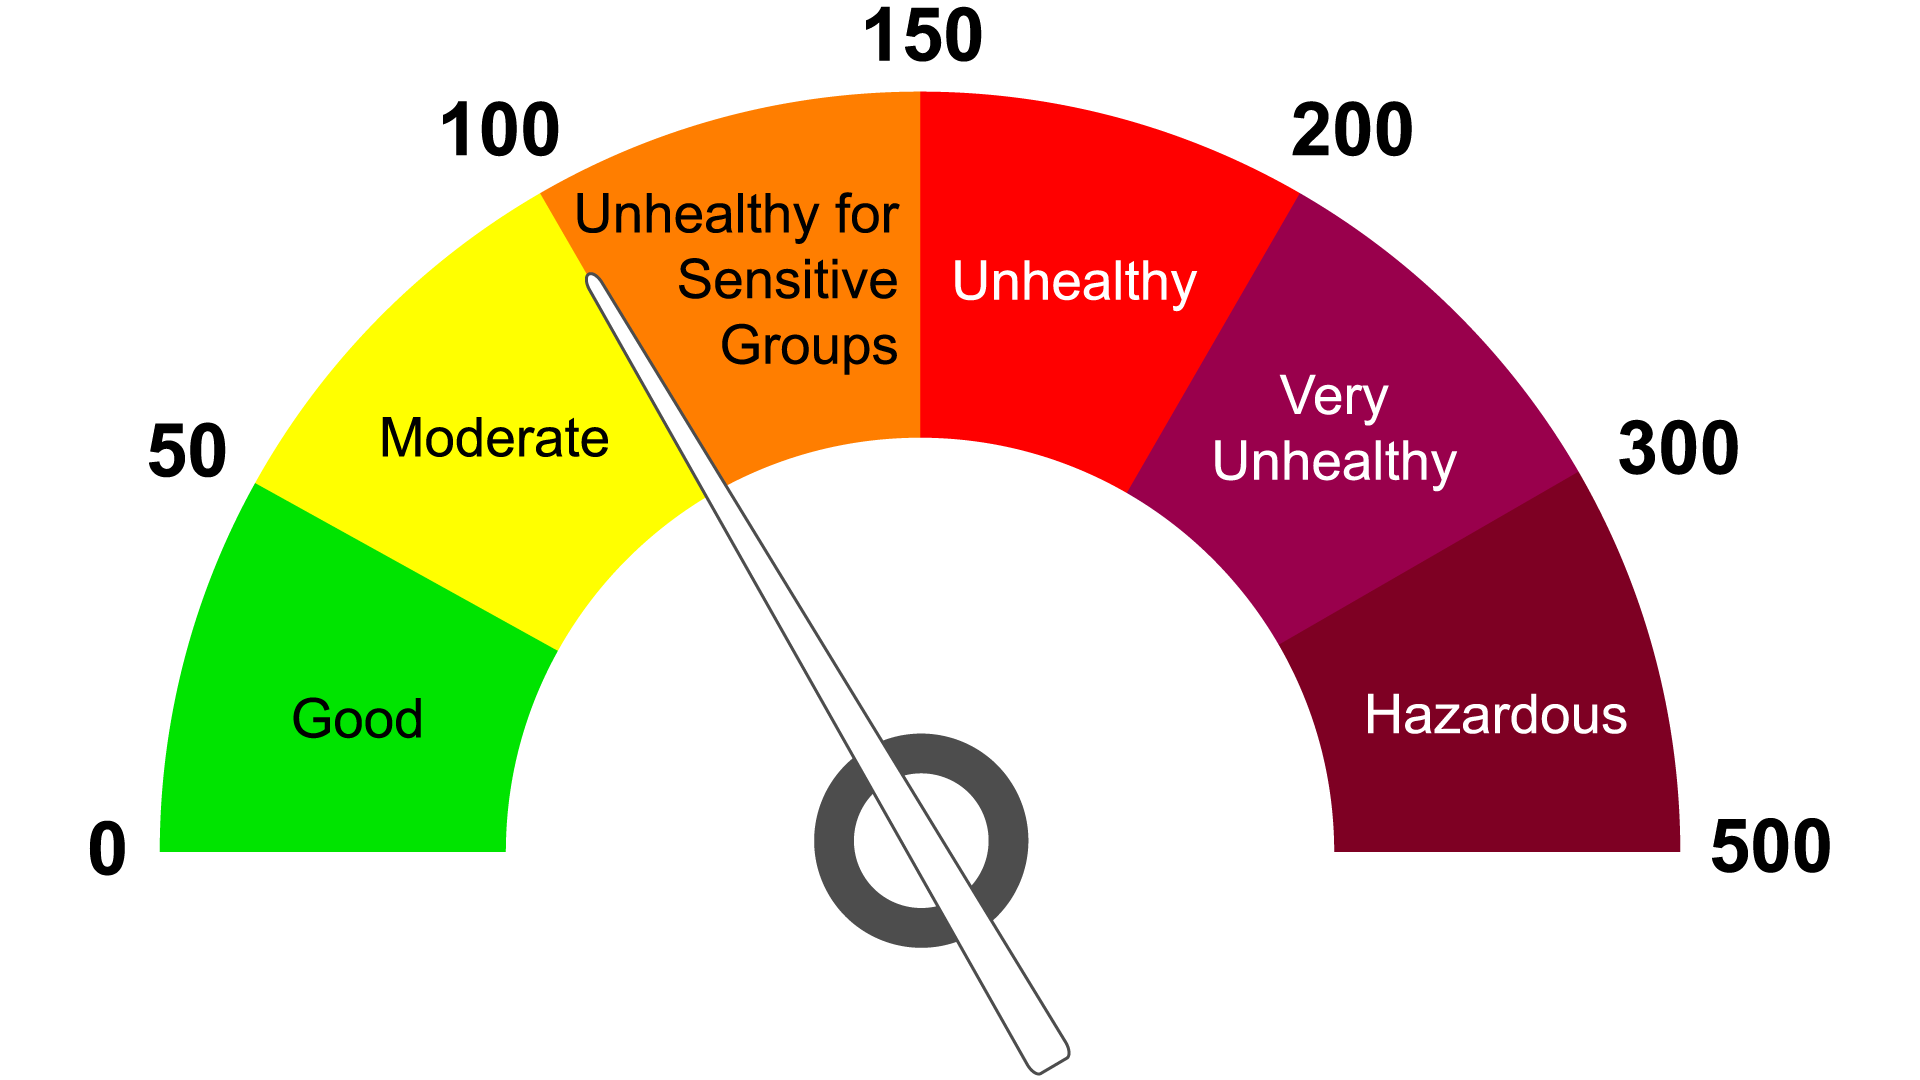
Because of the haze, the Federal Aviation Administration had to slow or cancel certain flights into New York City at LaGuardia and Newark Liberty International Airport. According to Airnow, the Air Quality Index (AQI), which monitors significant pollutants such as particulate matter caused by fires, was far above 400 in certain regions, with 100 being “unhealthy” and 300 being “hazardous”.
Beginning of the wildfires in Canada
A dry, hot climate too breeds more lightning. In an ordinary season, half of Canada’s rapidly spreading fires are begun by lightning, but those fires account for more than 85% of quickly spreading fire pulverization. The other half is human-caused. In Quebec, for illustration, fires were started by lightning, but authorities in Alberta have said that the cause of fires there’s currently unknown. Somewhere else within the nation, these fires have been human-caused in different ways from disposed of cigarette butts to sparkles from passing trains.
Air Quality Index (AQI) and Air Quality Database
The Air Quality Index (AQI) is used for daily air quality reports. It indicates how clean or polluted the air is and what health effects are of concern. AQI focuses on the health effects that can occur within hours or days of inhaling contaminated air. The United States Environmental Protection Agency (EPA) calculates the AQI for the five major air pollutants regulated by the Clean Air Act i.e. Ground-Level Ozone, Particulate Pollution/Matter, Carbon Monoxide, Sulphur Dioxide, and Nitrogen Dioxide.
The Air Quality Database is a gathering of data on air quality and particulate matter concentrations in the atmosphere. It began in 2011 and has since been updated on a standard basis. According to the WHO, the database will aid in studies on illnesses caused by air contamination by giving reliable assessments of population exposure.
Every year, the WHO publishes a database of ground measurements of air quality, notably particulate matter concentrations PM 2.5, PM 10, and Nitrogen Dioxide. In 2011, the database comprised interpretations from around 1,100 cities in 91 nations from 2003 to 2010.
What is modern within the sixth version?
Beginning with the 6th edition of the database in 2023, the database includes ground measurements of annual mean nitrogen dioxide concentrations for the second time. Nitrogen dioxide is described by the WHO as “a common urban pollutant and a precursor to particulate matter and ozone”. However, this data was not recorded in previous versions of his database for 2011, 2014, 2016, and 2018, and was recorded for the first time in 2022. The sixth update of the database “provides the most comprehensive coverage of surface air pollution to date”.
The 2023 version includes data on annual averages of PM2.5, PM10, and Nitrogen Dioxide from 2010 to 2023 for 8,168 settlements in 124 countries. The average values in the database are usually related to the city/municipalities as a whole rather than individual measuring stations.
Consequences of Contaminants
Particulate matters PM2.5 and PM10 are fine dust with a maximum diameter of 2.5 microns and 10 microns. The pollutants come mainly from human activities related to the burning of fossil fuels, indicating the danger of air pollution to humans, and many air pollutants can cause significant damage even at low concentrations. Nitrogen Dioxide (NO2) originates primarily from anthropogenic fuel combustion (e.g., from traffic) and is especially common in urban areas. There is a possibility that particulate matter, especially PM 2.5, penetrates deeply into the lungs and human bloodstream and can affect cardiovascular, cerebrovascular, and respiratory systems, whereas nitrogen dioxide is associated with respiratory diseases, especially asthma.